Scientific Computing
Our scientific computing team offers software development and research and development (R&D). We specialize in algorithms for analyzing computational data and in modeling for qualitative and quantitative data analysis.
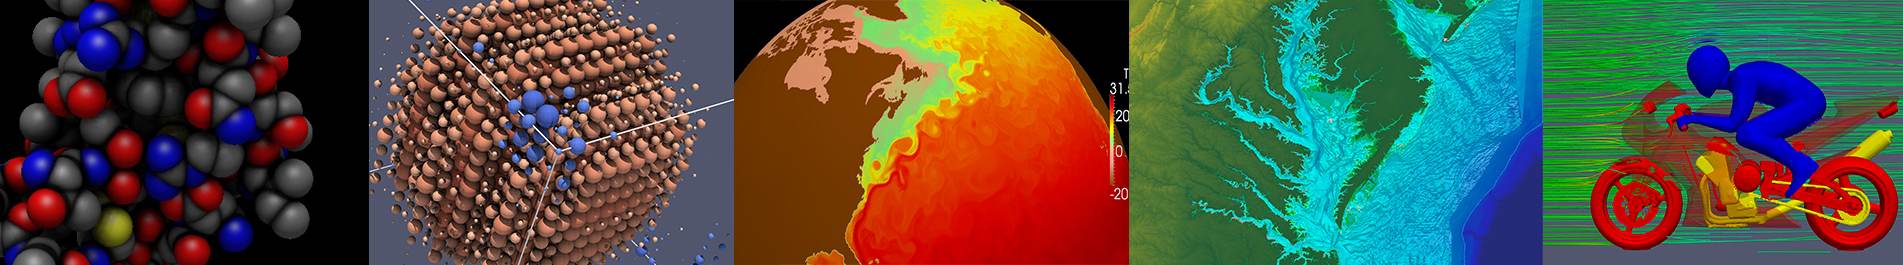
Our R&D staff has worked with customers to create custom applications and plugins to solve specific problems, such as visualizing and analyzing data from LiDar sensors, simulating blood flow within the body, and analyzing trends in global climate data. Most of the algorithms created for these efforts have been integrated into the Visualization Toolkit (VTK). Our expertise in HPC and visualization started with VTK, which has become the standard for visualization software development with thousands of active users. Our team has created many algorithm plugins for computing derived data. Additional applications have added a highly customizable, easy-to-use end-user experience for building computational models and rendering data visualizations. As a result, users can interactively explore their data.
Our open source, multi-platform data analysis and visualization tools are scalable. They handle extremely large datasets that run on supercomputers or distributed systems as well as small datasets that run on individual laptops. Using efficient rendering techniques, we have created a responsive viewer that works in real time and several tools that enable visualization on mobile and web platforms.
Demos
Areas of Focus
In Situ Computing
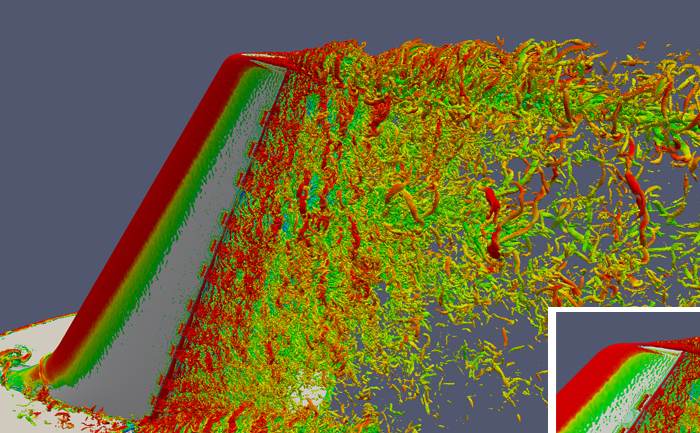
Input/output (I/O) is one of the most pressing challenges with large-scale simulations. It is already common for simulations to discard most of what they compute in order to minimize time spent on I/O. As scientific computing moves to the exascale, the disparity between computational capability and I/O capability continues to expand. Since storing data is no longer viable for many simulation applications, data analysis and visualization must now be performed in situ. ParaView Catalyst is a light-weight version of the ParaView server library that is designed to be directly embedded into parallel simulation codes to perform in situ analysis and visualization at runtime. ParaView Catalyst was used with SENSEI in the largest-to-date in situ simulation run. The run was the first known to exceed the milestone of one million Message Passing Interface (MPI) processes.
Visualization and Analysis
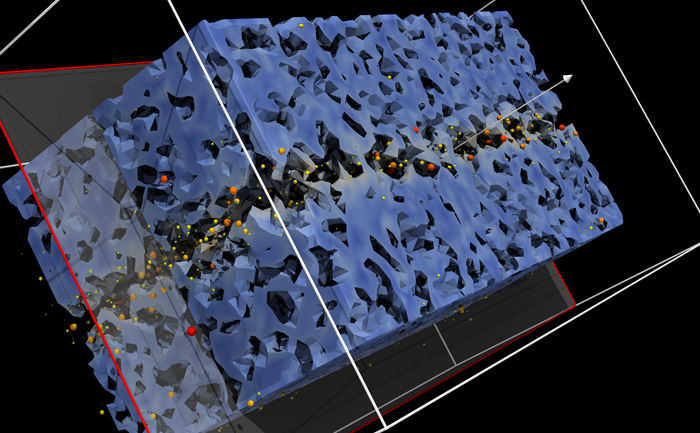
Data analysis is often the most critical bottleneck in the scientific discovery process. The exponential growth of datasets in size, scale, complexity, and richness makes it difficult for researchers and scientists to analyze data and obtain insight. As data approaches exascale, this problem becomes even more pressing. Moreover, data is becoming increasingly complex, not only because of enhanced resolution but because of the integration of experimental observations and associated metadata within datasets. We address these large data analysis issues by providing expertise in high-performance computing, distributed visualization, and data processing. We develop the computational infrastructure and tools to power large data analysis and visualization, in particular VTK and ParaView. These tools enable scientists to tackle today’s most pressing research challenges.
End-to-End Simulation Workflows
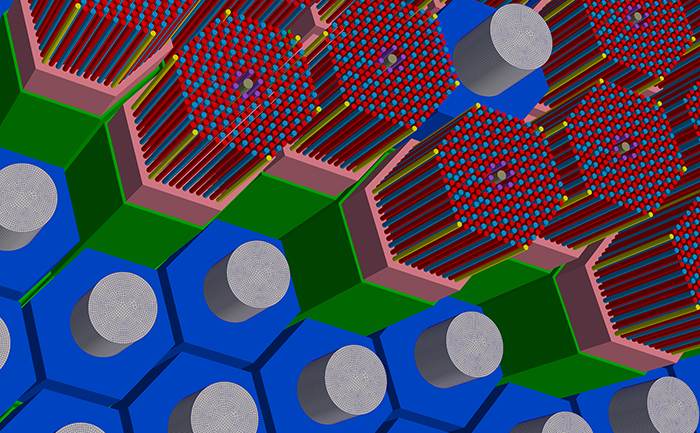
We have expertise developing tools that address the simulation workflow from defining the proper geometric shape or mesh, to integrating simulation parameters, to queuing the simulation job, to visualizing and analyzing the simulation results. This approach to simulation workflow management breaks down the monolithic approach to HPC and simulation. Our approach is much more modular, and it can be easily tailored to specific simulations from hydrological to nuclear reactor simulations.
Web-based Computing
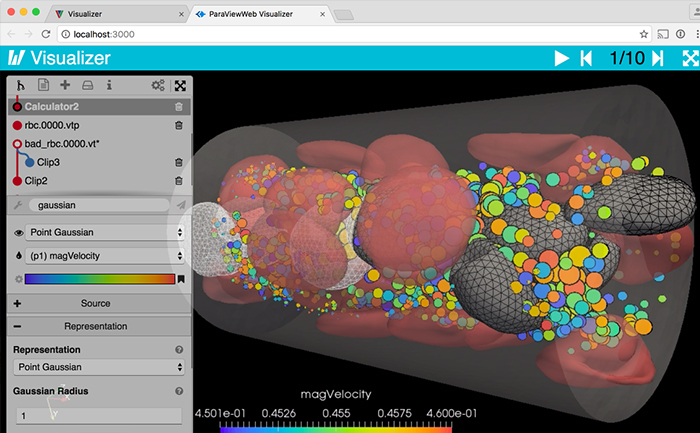
We have created an easily customizable web framework, ParaViewWeb, to build applications with interactive scientific visualization inside the web browser. Coupling our visualization expertise with next-generation web technologies, we have structured ParaViewWeb so that it provides a collection of visualization components to illustrate patterns and structure in large datasets. Each component highlights one of the many possible ways of viewing datasets. These visualization components can be integrated into a web-based workbench-like environment that provides new interfaces to support discovery, exploration, filtration, and analysis.
What We Offer For Your Project
We provide custom research and software development, collaboration, support, training, and books to help in the above areas of focus.
HPC and Visualization Platforms

ParaView builds interactive, scientific visualizations to analyze data using qualitative and quantitative techniques. It has a client–server architecture to facilitate remote visualization of datasets, and it generates level of detail (LOD) models to maintain interactive frame rates for large datasets.
![]()
The Visualization Toolkit (VTK) is a software development toolkit for processing and visualizing data. It supports a wide variety of visualization algorithms including scalar, vector, tensor, texture, and volumetric methods. It also supports advanced modeling techniques such as implicit modeling, polygon reduction, mesh smoothing, cutting, contouring, and Delaunay triangulation.

Computational Model Builder (CMB) offers an end-to-end solution for supporting simulation lifecycles. These include geometric models, simulation information, and meshes.

The primary focus of Tomviz is to provide a complete solution, from raw projection images to reconstructed electron tomography data, for materials using a state-of-the-art graphical interface.