Data and Analytics
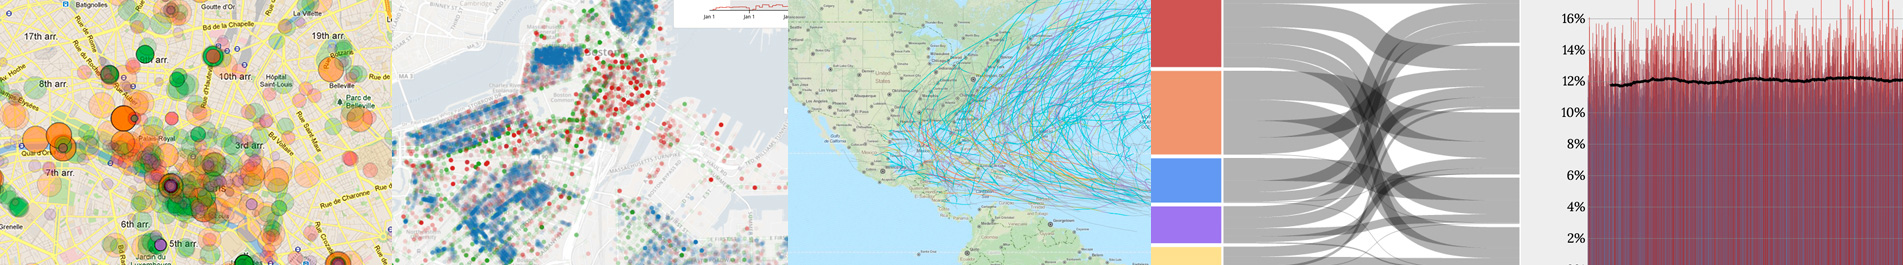
Our data and analytics team has created a platform of tools to enhance the way customers use data. The platform has an end-to-end workflow that collects, stores, processes, mines, and visualizes data. The resulting tools have proven valuable across multiple disciplines from scientific research, to engineering design, to software development. With scalable, web-based data management; powerful, intuitive analytics engines; and functionality to create graphs, charts, geospatial maps, and other visualizations, these tools are designed to enable powerful custom solutions for any data need.
We partner with universities on government-funded projects and with commercial companies on product development. For example, we have worked with researchers at the Georgia Institute of Technology, Harvard University, the University of Washington, and the University of Utah on web-based data visualization tools for the Defense Advanced Research Projects Agency’s (DARPA’s) XDATA project. Our data management tools have also been used by commercial companies to enhance their software development processes as well as by doctors and medical associations to gather imaging data and to create communities around solving clinical problems.
From Our Blog
From Data Chaos to Clarity: Best Practices for Managing Complex Datasets
Data is one of the most powerful assets in modern research, but without the right infrastructure, it can become fragmented, inconsistent, and difficult to leverage. For scientists and organizations working with large, complex datasets, this can slow progress, limit collaboration, and add unnecessary costs. Modern data portals solve these common pain points.

VTK and NumPy – a new take
Ten years ago, I wrote this series of blogs introducing a (then) new way of interfacing VTK and NumPy. In the first blog, I had a teaser that I then expanded on: Over the last year, we have introduced a simpler and more pythonic interface. As of VTK 9.4, the code above can be expressed […]
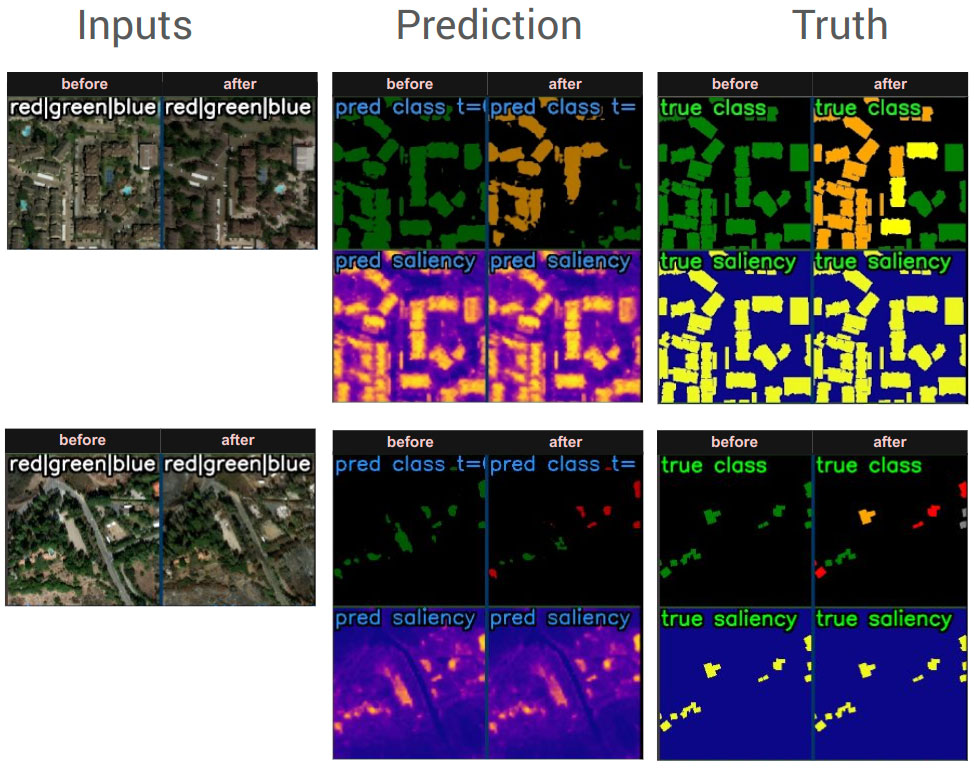
GeoWATCH
GeoWATCH is a powerful tool designed to train, predict, and evaluate AI models on complex heterogeneous sequences of imagery. While initial development focused on geospatial satellite imagery, it is designed for any sequence of rasters. Unlike traditional tools, it’s built to handle diverse sensor data, accommodating variations in band type, resolution, and revisit rates. This flexibility empowers GeoWATCH to provide valuable insights across domains, from satellite imagery analysis to effectively any problem that requires jointly considering sequences of raster data.
Areas of Focus
Advanced Software Metrics
Software is quickly becoming more nuanced and competitive with the advent of complex domains such as virtual reality and artificial intelligence. As a result, it is more important than ever to understand how code performs and how it improves over time. We help make sense of data through grand challenges that crowd-source advanced research or through metrics and dashboards that make it clear exactly where improvements are made and where gaps exist.
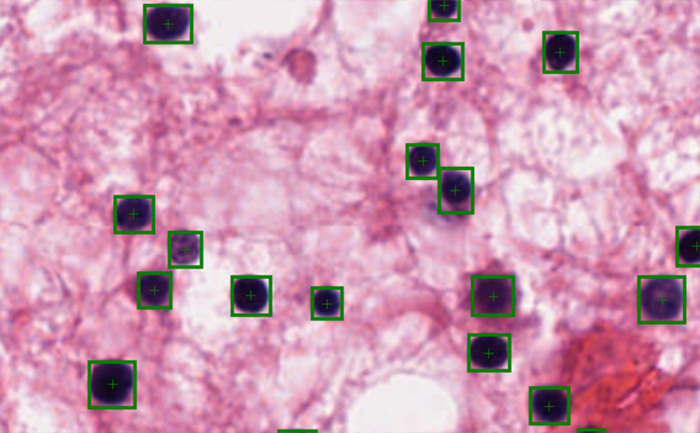
Bioinformatics and Large-scale Imagery
Our solutions connect cutting-edge bioinformatics research to a solid, extensible platform, where open science is front and center. We develop data management, analysis management, and visualization applications for a wide range of areas including genomics, metabolomics, and phylogenetics. From browsing and analyzing large histology slides on the web, to stabilizing and sharing new ‘omics algorithms through a robust web application, we have data and analytics covered.
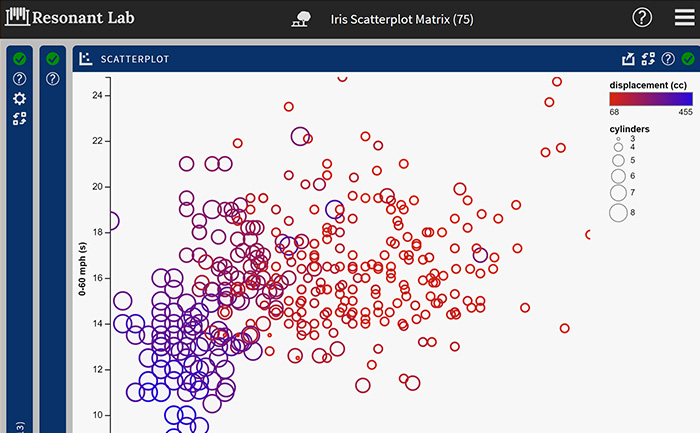
Visual Data Science
We extend our heritage as leaders in scientific visualization with the Visualization Toolkit (VTK) through new visualization solutions for use in general data exploration and understanding. Our web visualizations bring together the best in modern visual analysis, lighting up data in new ways.
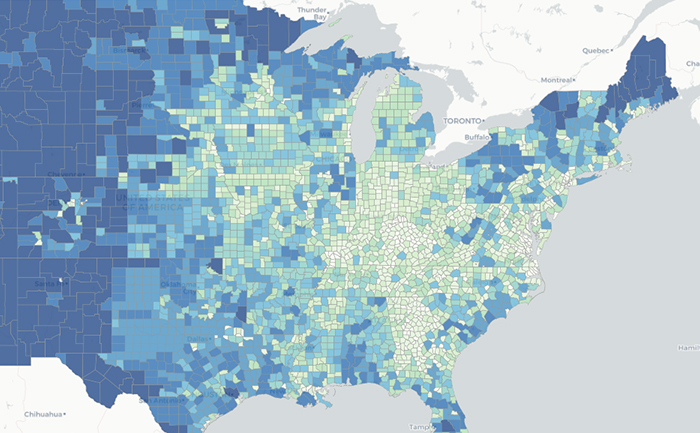
Geospatial Analysis
We offer advanced capabilities for geospatial analysis and visualization. We support a range of use cases from analyzing geolocated Twitter traffic, to processing and viewing complex climate models, to working with large satellite imagery datasets. Our open source tools and expert staff provide full application solutions, linking raw datasets and geospatial analyses to custom web visualizations.
What We Offer for Your Project
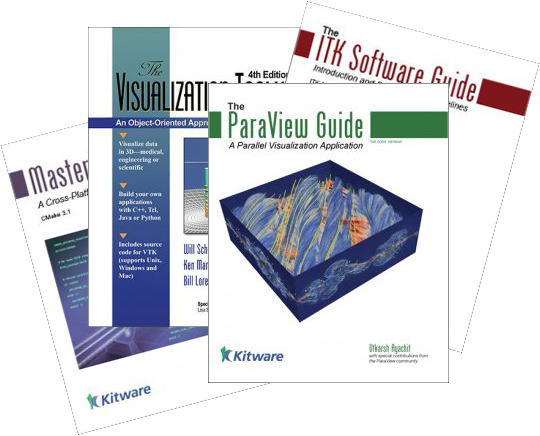
We provide custom research and software development, collaboration, support, training, and books to help in the above areas of focus.
Data and Analytics Platform
The Resonant platform contains open source, web-based tools that store, analyze, and visualize larege datasets from a variety of sources. These tools provide capabilities that include uploading, sharing, managing, exploring, and exporting data. The platform makes it easy to get started, and it offers the ability to create graphs and images without writing code.